
One number everyone agrees on
Dashboards scoped to you, your team or the agency, a scoreboard people actually check, persistency analytics and a weekly carrier report calendar.
Book a demoThe agent
Her own production, her book and where she ranks.
The manager
His team, down every level, and who needs a call today.
The owner
The whole agency, against the monthly goal.
Monday meetings used to start with which number was right
- The carrier portal says one thing, the commission spreadsheet another, the group chat a third.
- Every Monday meeting starts with which number is right.
- Agents stop trusting the leaderboard, so they stop looking at it.
Carrier portals
Missing two carriers
$104,210
Commission sheet
Counts a withdrawn app
$111,980
Group chat
From memory
about 98k
Vora, agency scope, October
$109,543.80
Submitted production. The same figure on the dashboard, the scoreboard, the assistant and the API.
Example figures.
Every dashboard, scoreboard and export reads from one calculation layer.
The agent, the manager and the owner see the same figure, cut to their scope.
The meeting starts with what to do about the number.
Me, my team, the agency
One switch changes the scope. The numbers come from the same place every time, so the team total is always the sum of the people in it.
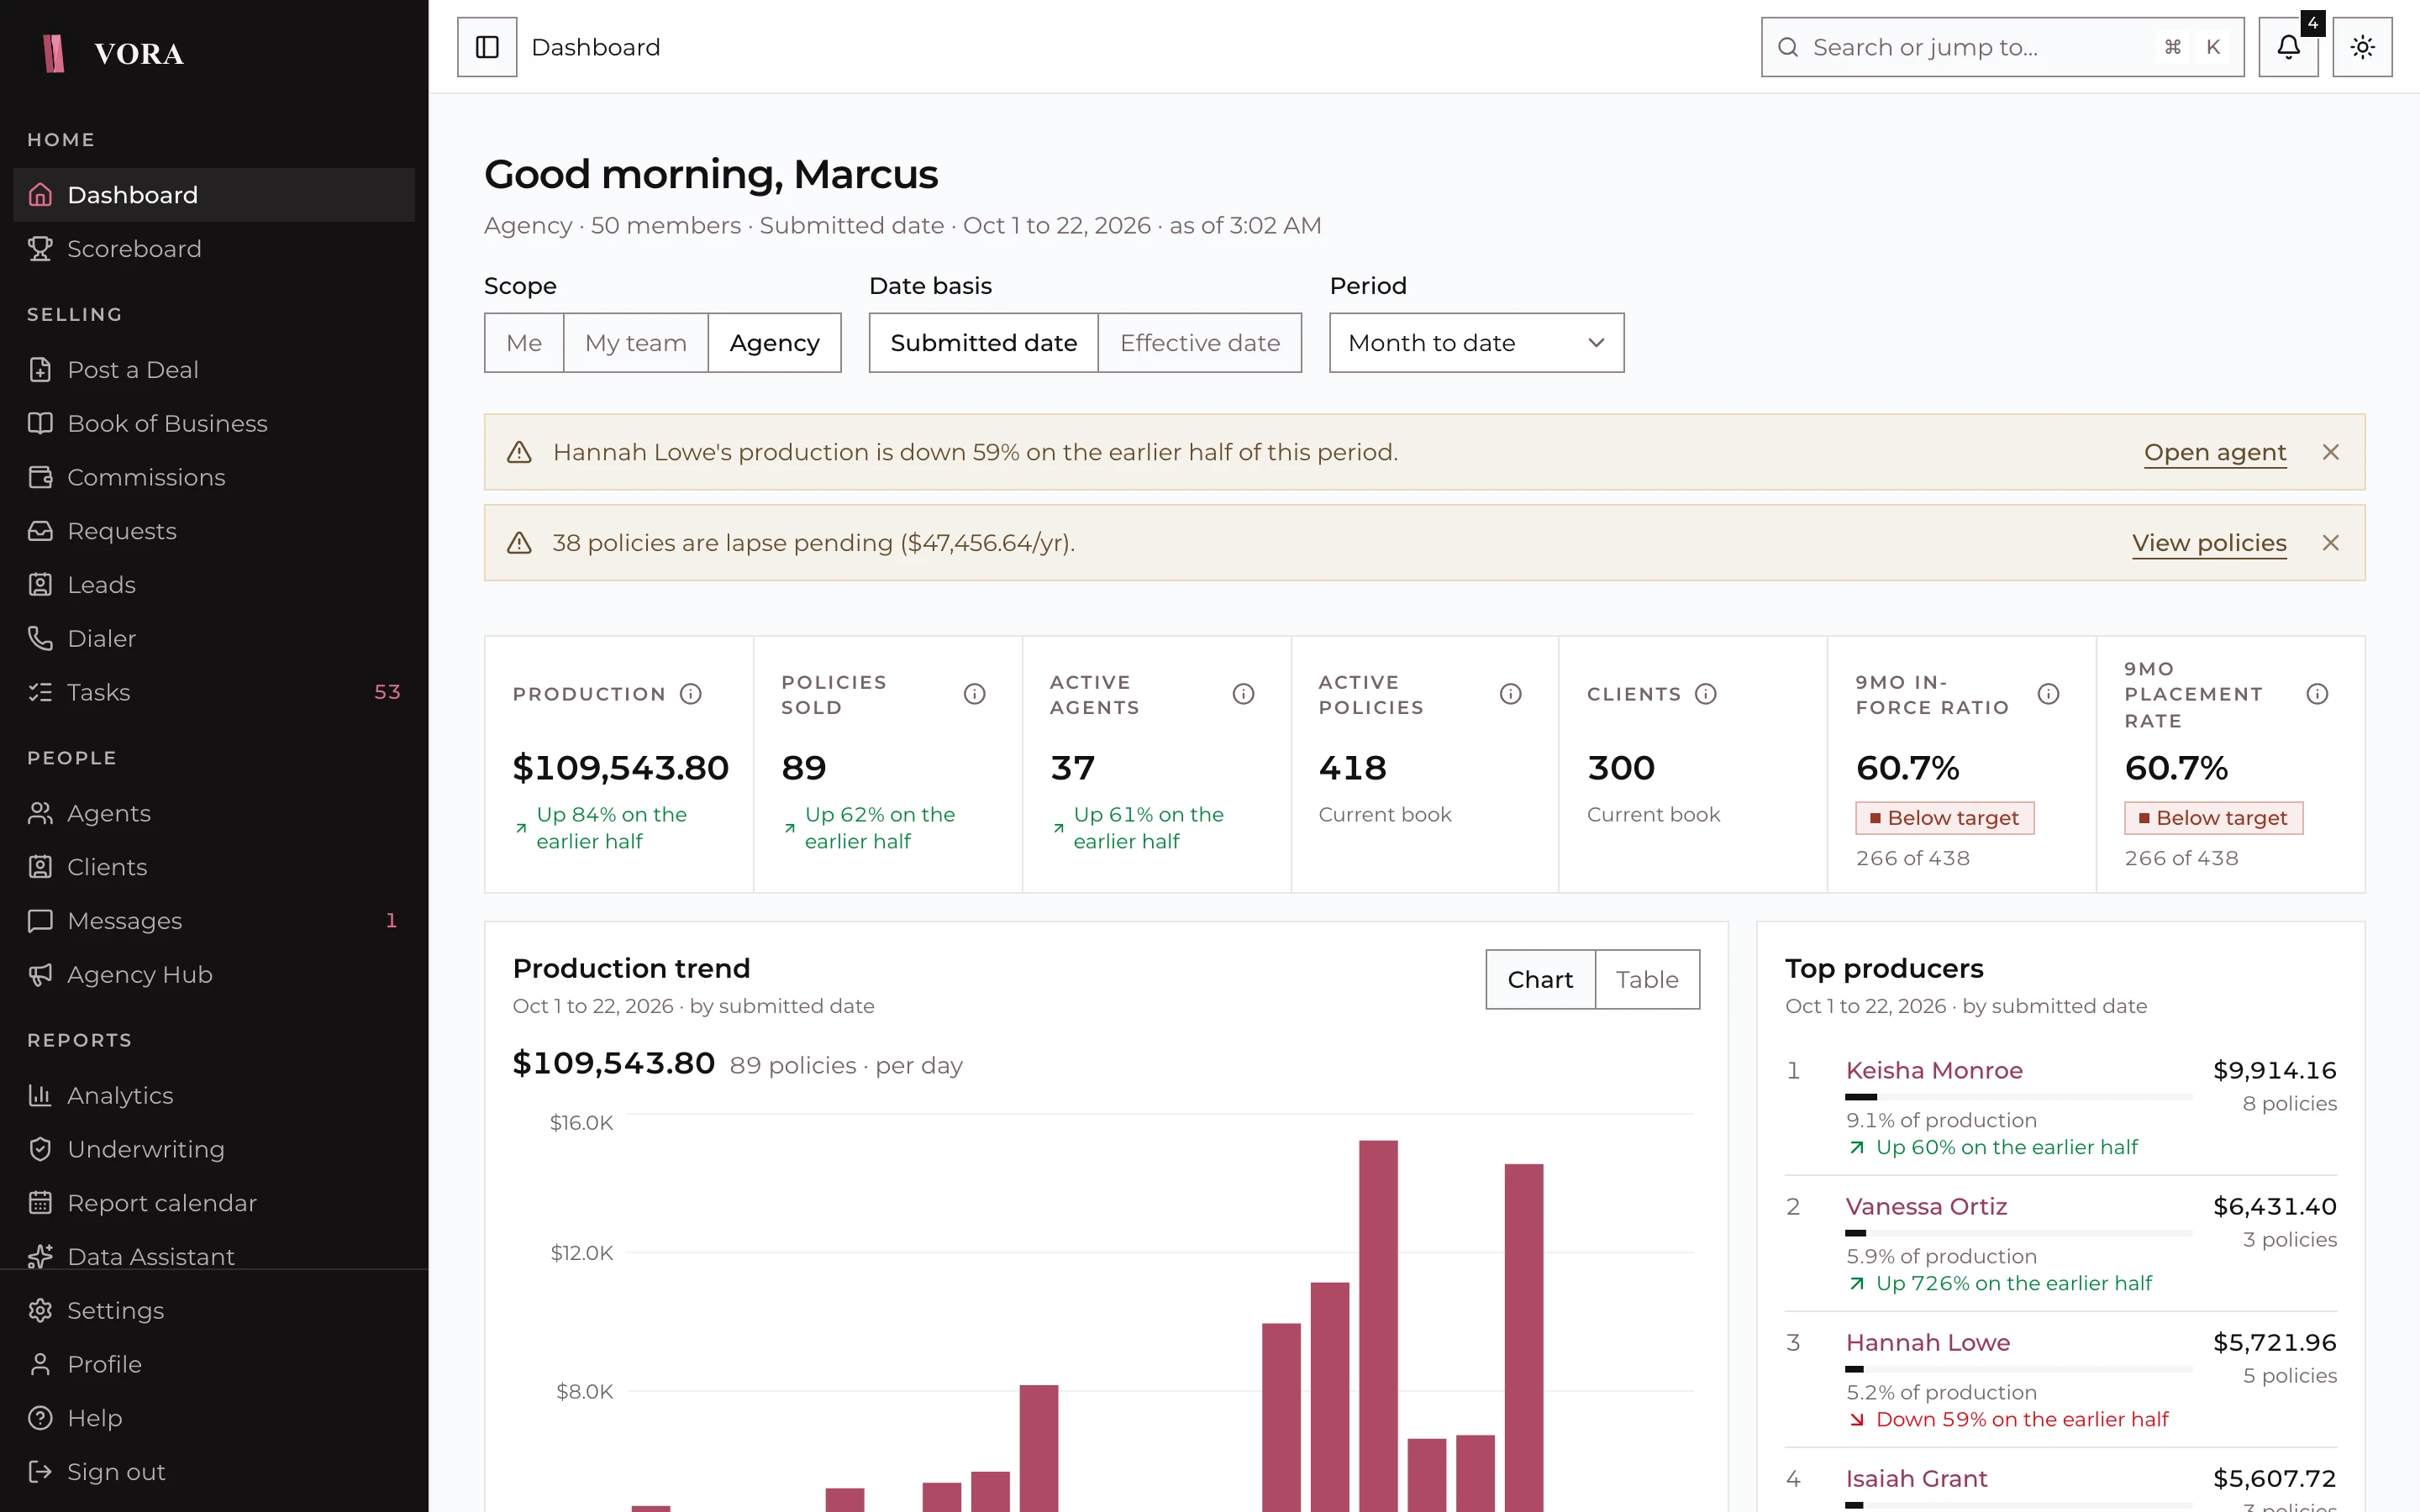
Production overview, policy health, book mix, top producers and recent activity, scoped to me, my team or the whole agency. A monthly goal meter and rule-based insights point to what needs attention.
Signed in as Victoria Hale, agency owner
Showing the whole agency's numbers, signed in as Victoria Hale, agency owner.
Production
$109,543.80
Policies sold
89
Active agents
37
9-month in force
60.7%
Policies submitted per day, last seven days
Example figures. Every screen reads from one calculation layer, so the numbers agree everywhere.
Read the dashboard like the owner who built it
The numbers people actually check
Scoreboard and leaderboard
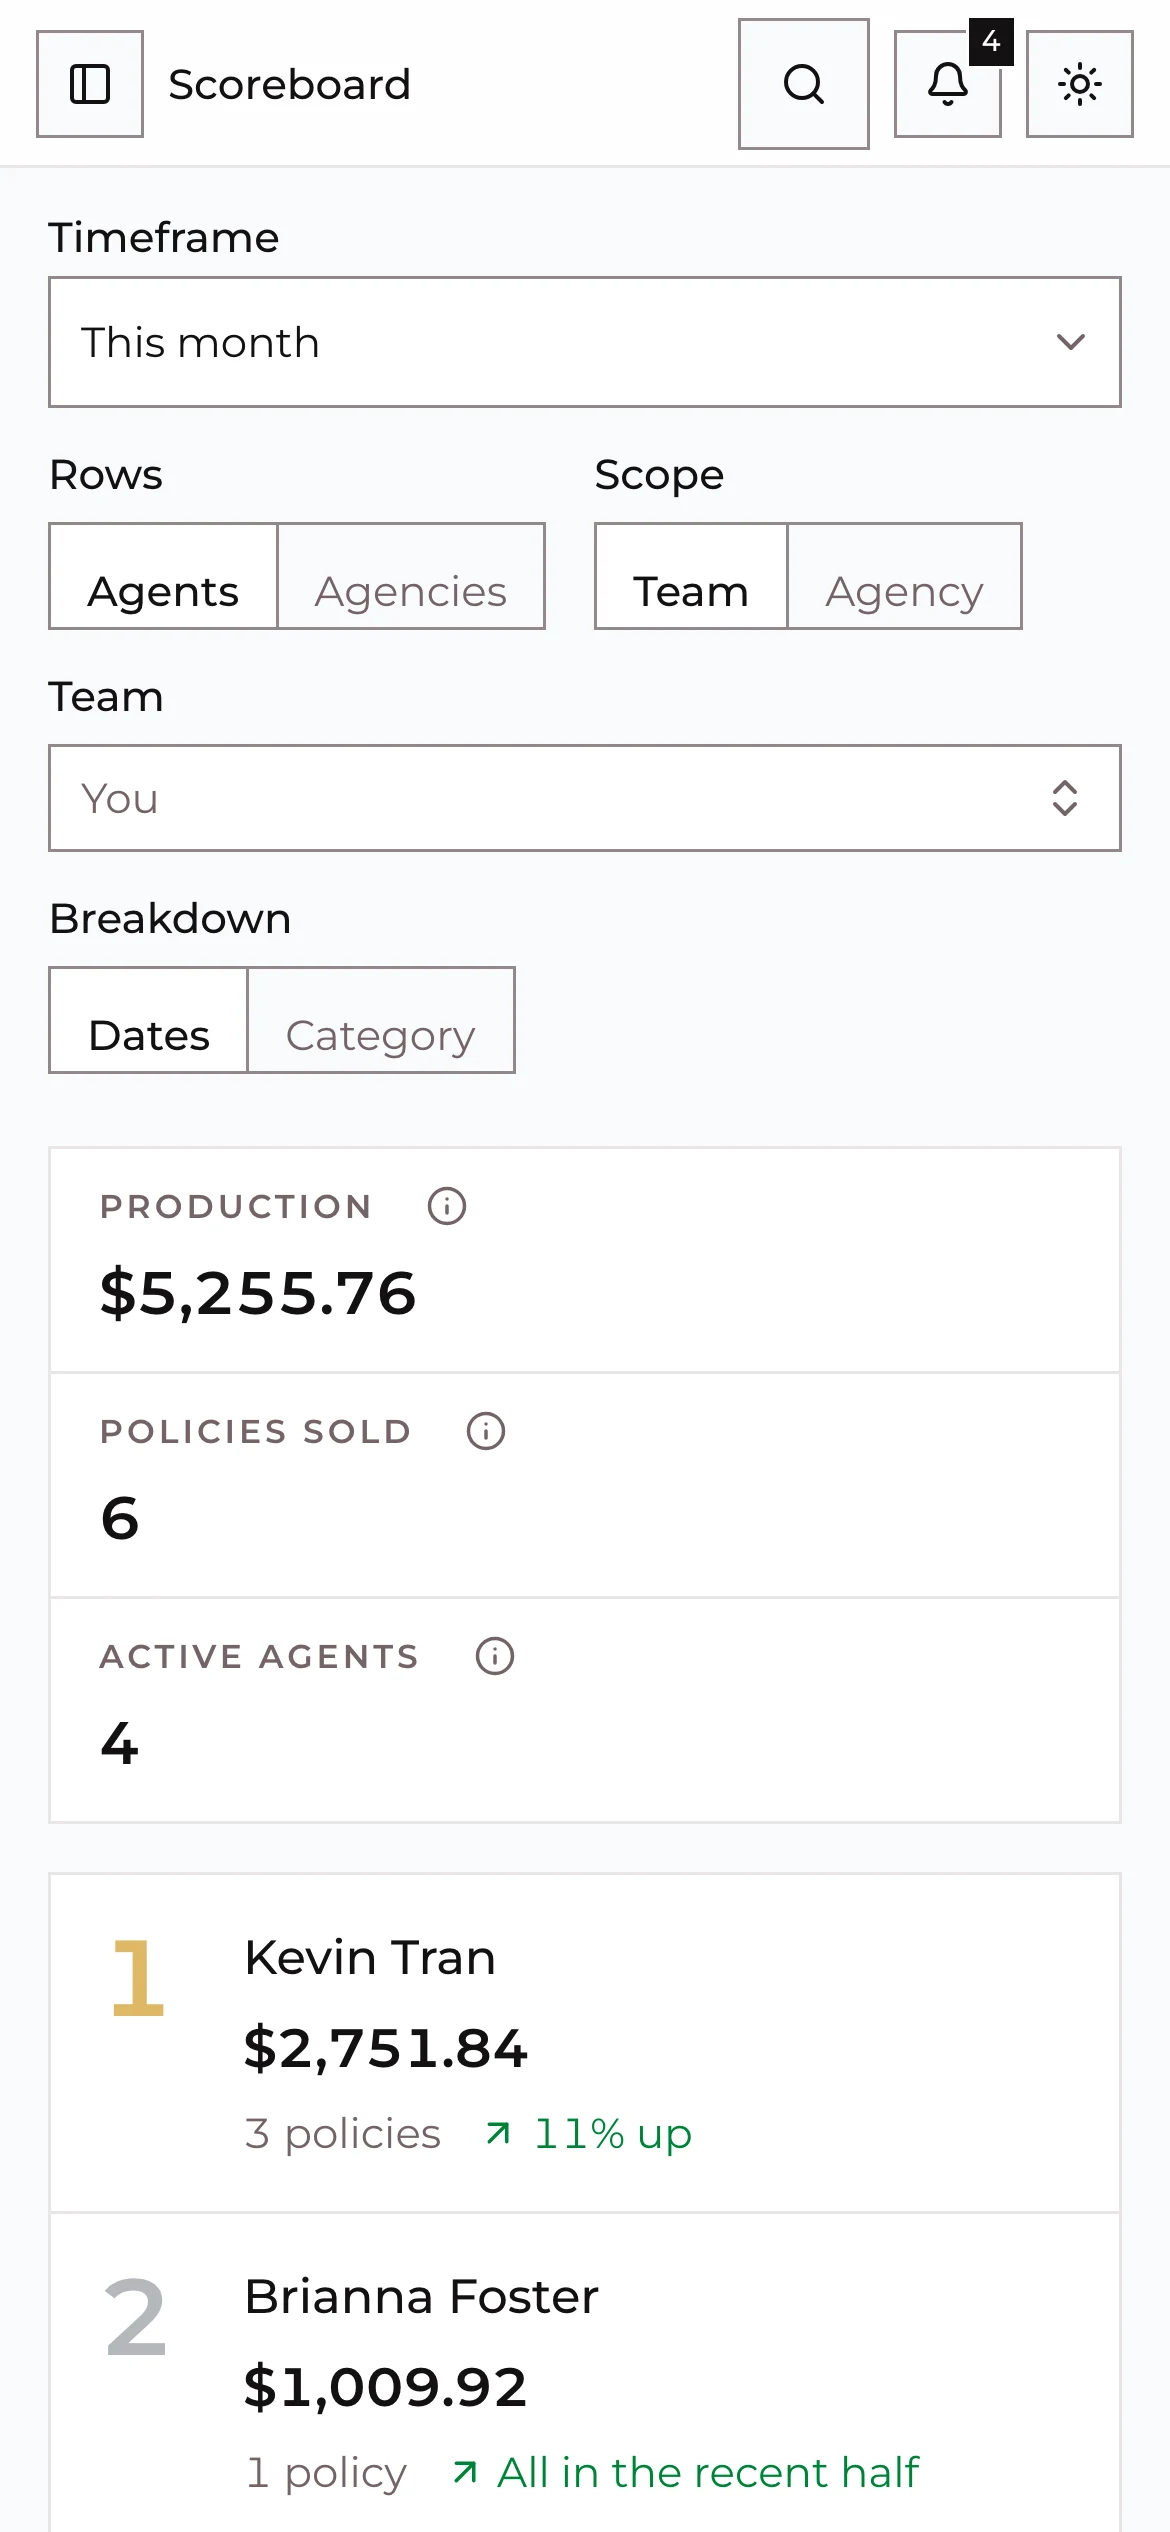
Rank by timeframe and category, with privacy settings and CSV export for admins and managers. Agencies can opt in to a public leaderboard that shows first name and last initial only.
Persistency analytics
Checkpoint persistency with breakdowns and trends, so you can see which carriers, products and agents keep business on the books.
Example checkpoints.
96%
1 mo
91%
2 mo
82%
4 mo
71%
7 mo
64%
9 mo
Report calendar
The weekly carrier report schedule with reminders, an immutable snapshot when a week is finalised, and CSV export.
- Wk 40Snapshot finalised
- Wk 41Snapshot finalised
- Wk 426 of 9 carriers in
- Wk 43Reminder Monday
- Me, team and agency scopes
- Monthly goal meter
- Scoreboard with privacy controls
- Opt-in public leaderboard
- Persistency by checkpoint
- Immutable weekly snapshots
Works with
All features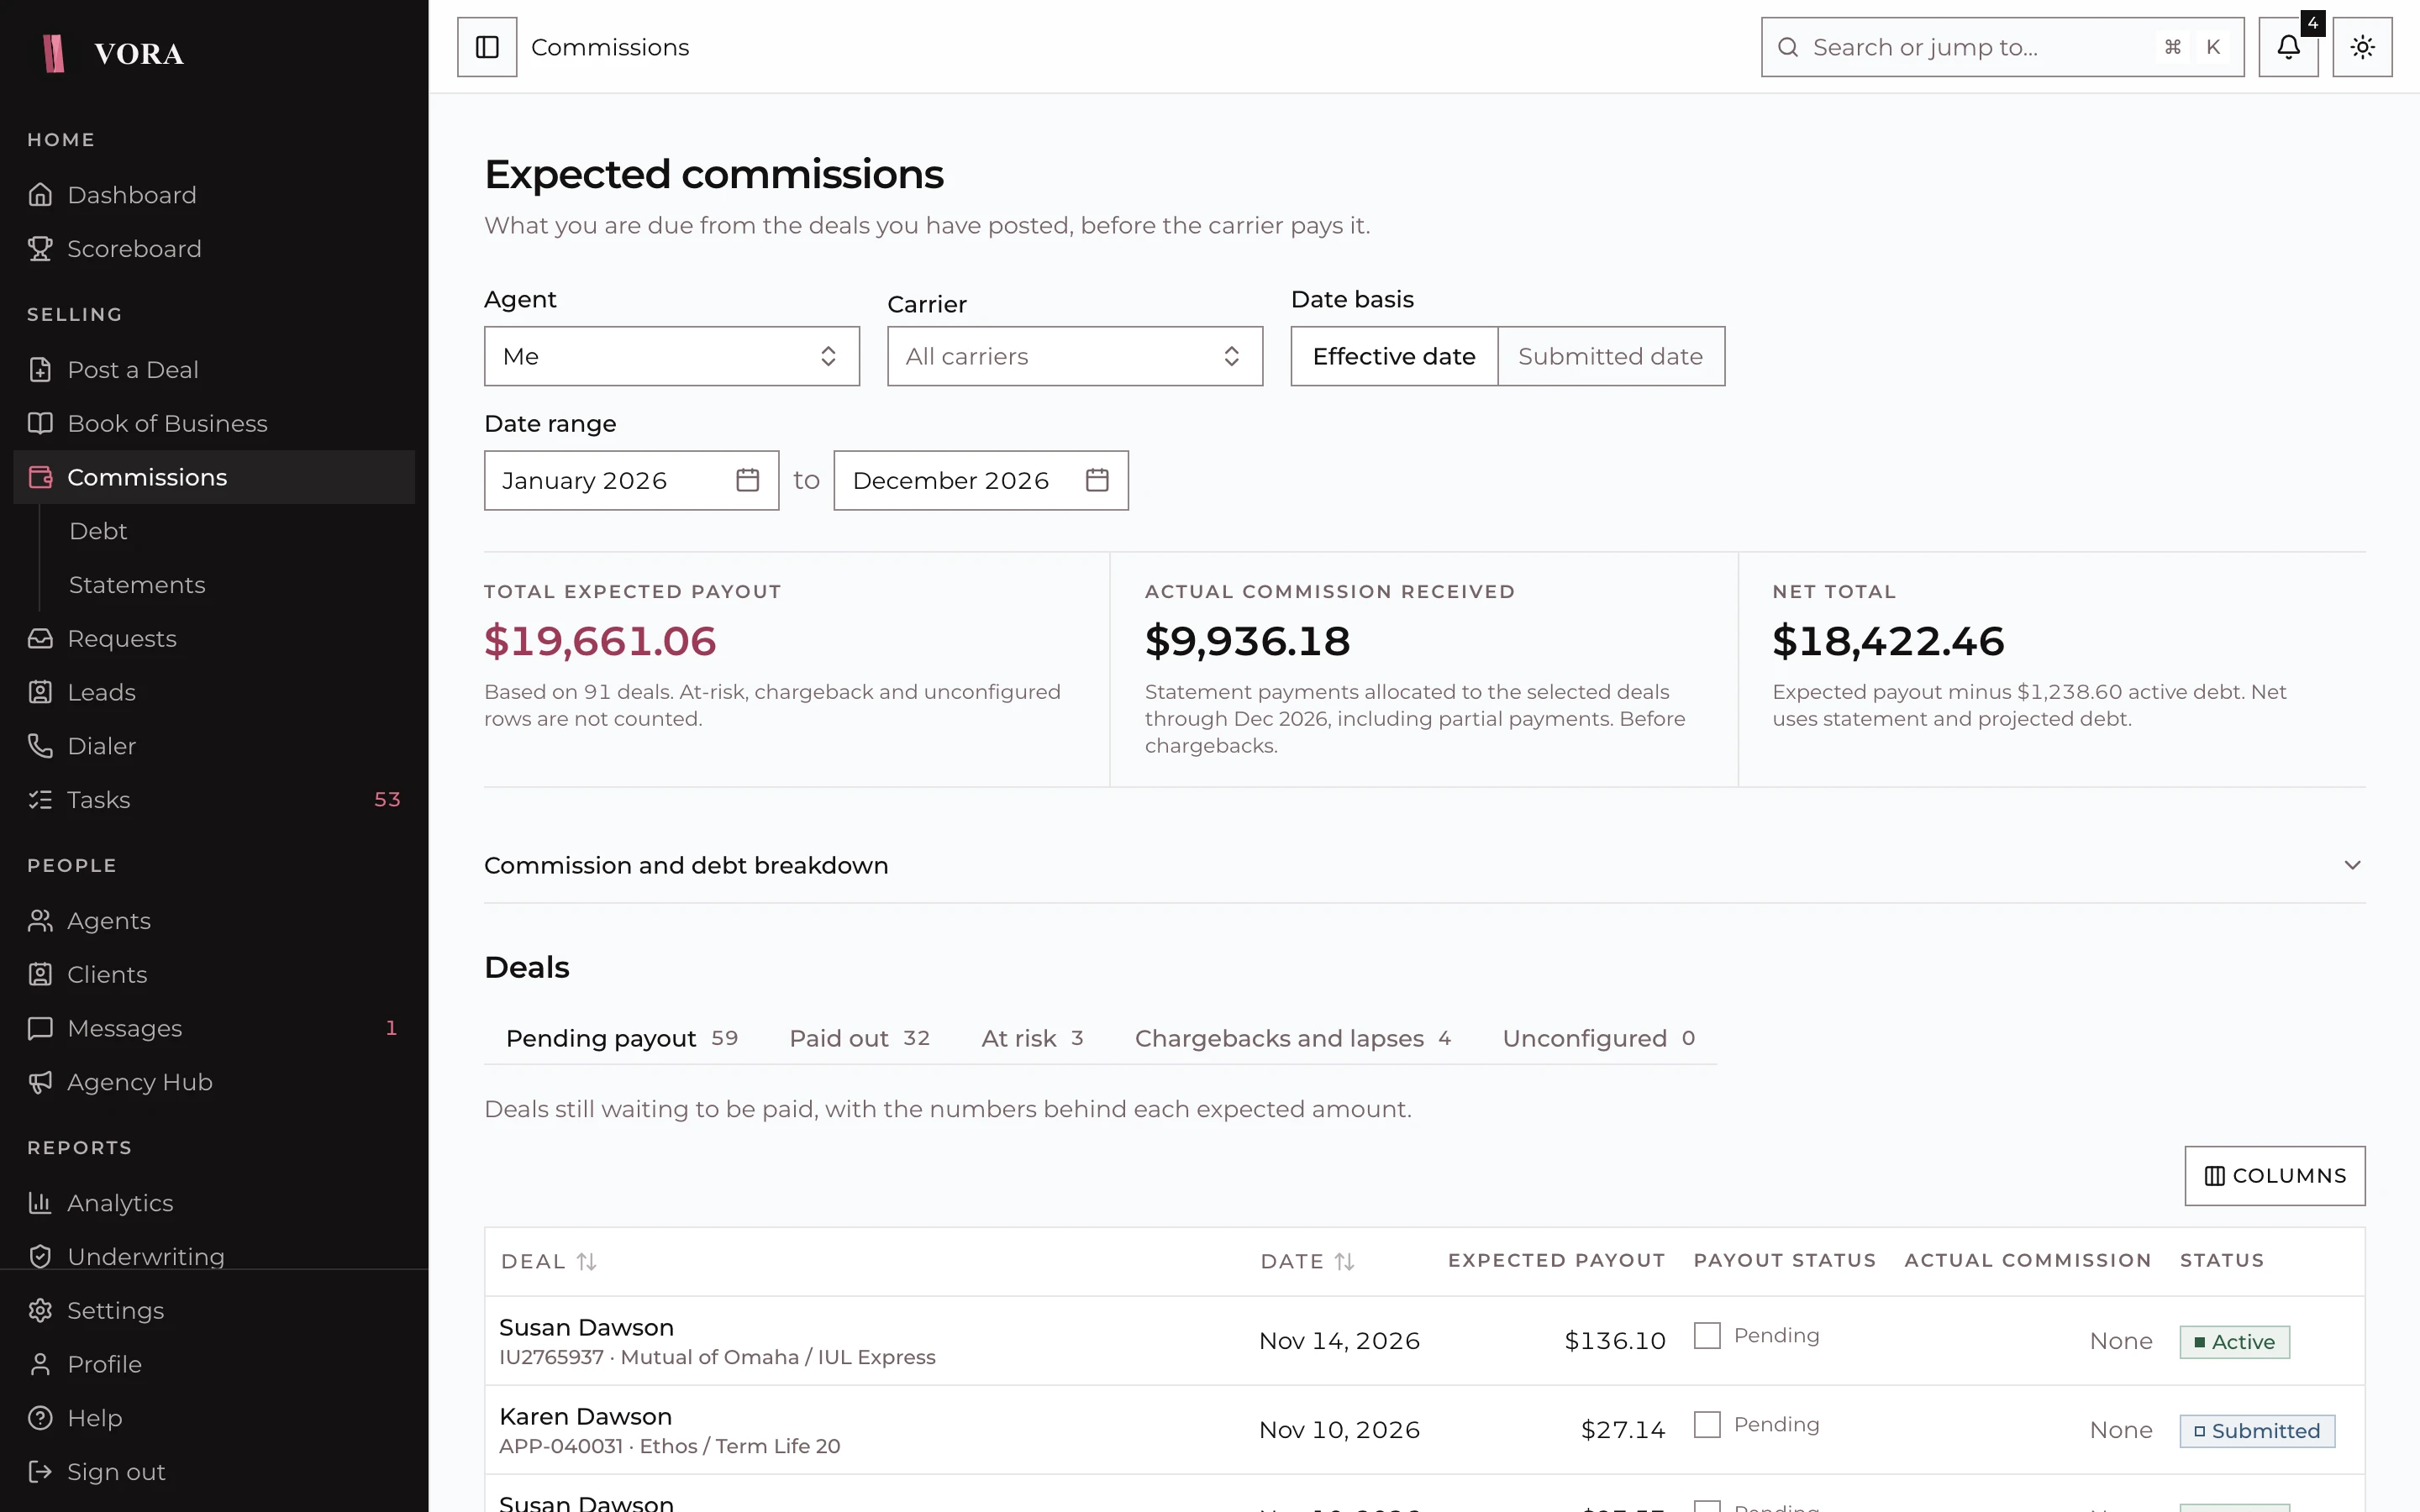
Give your managers a number they can coach from
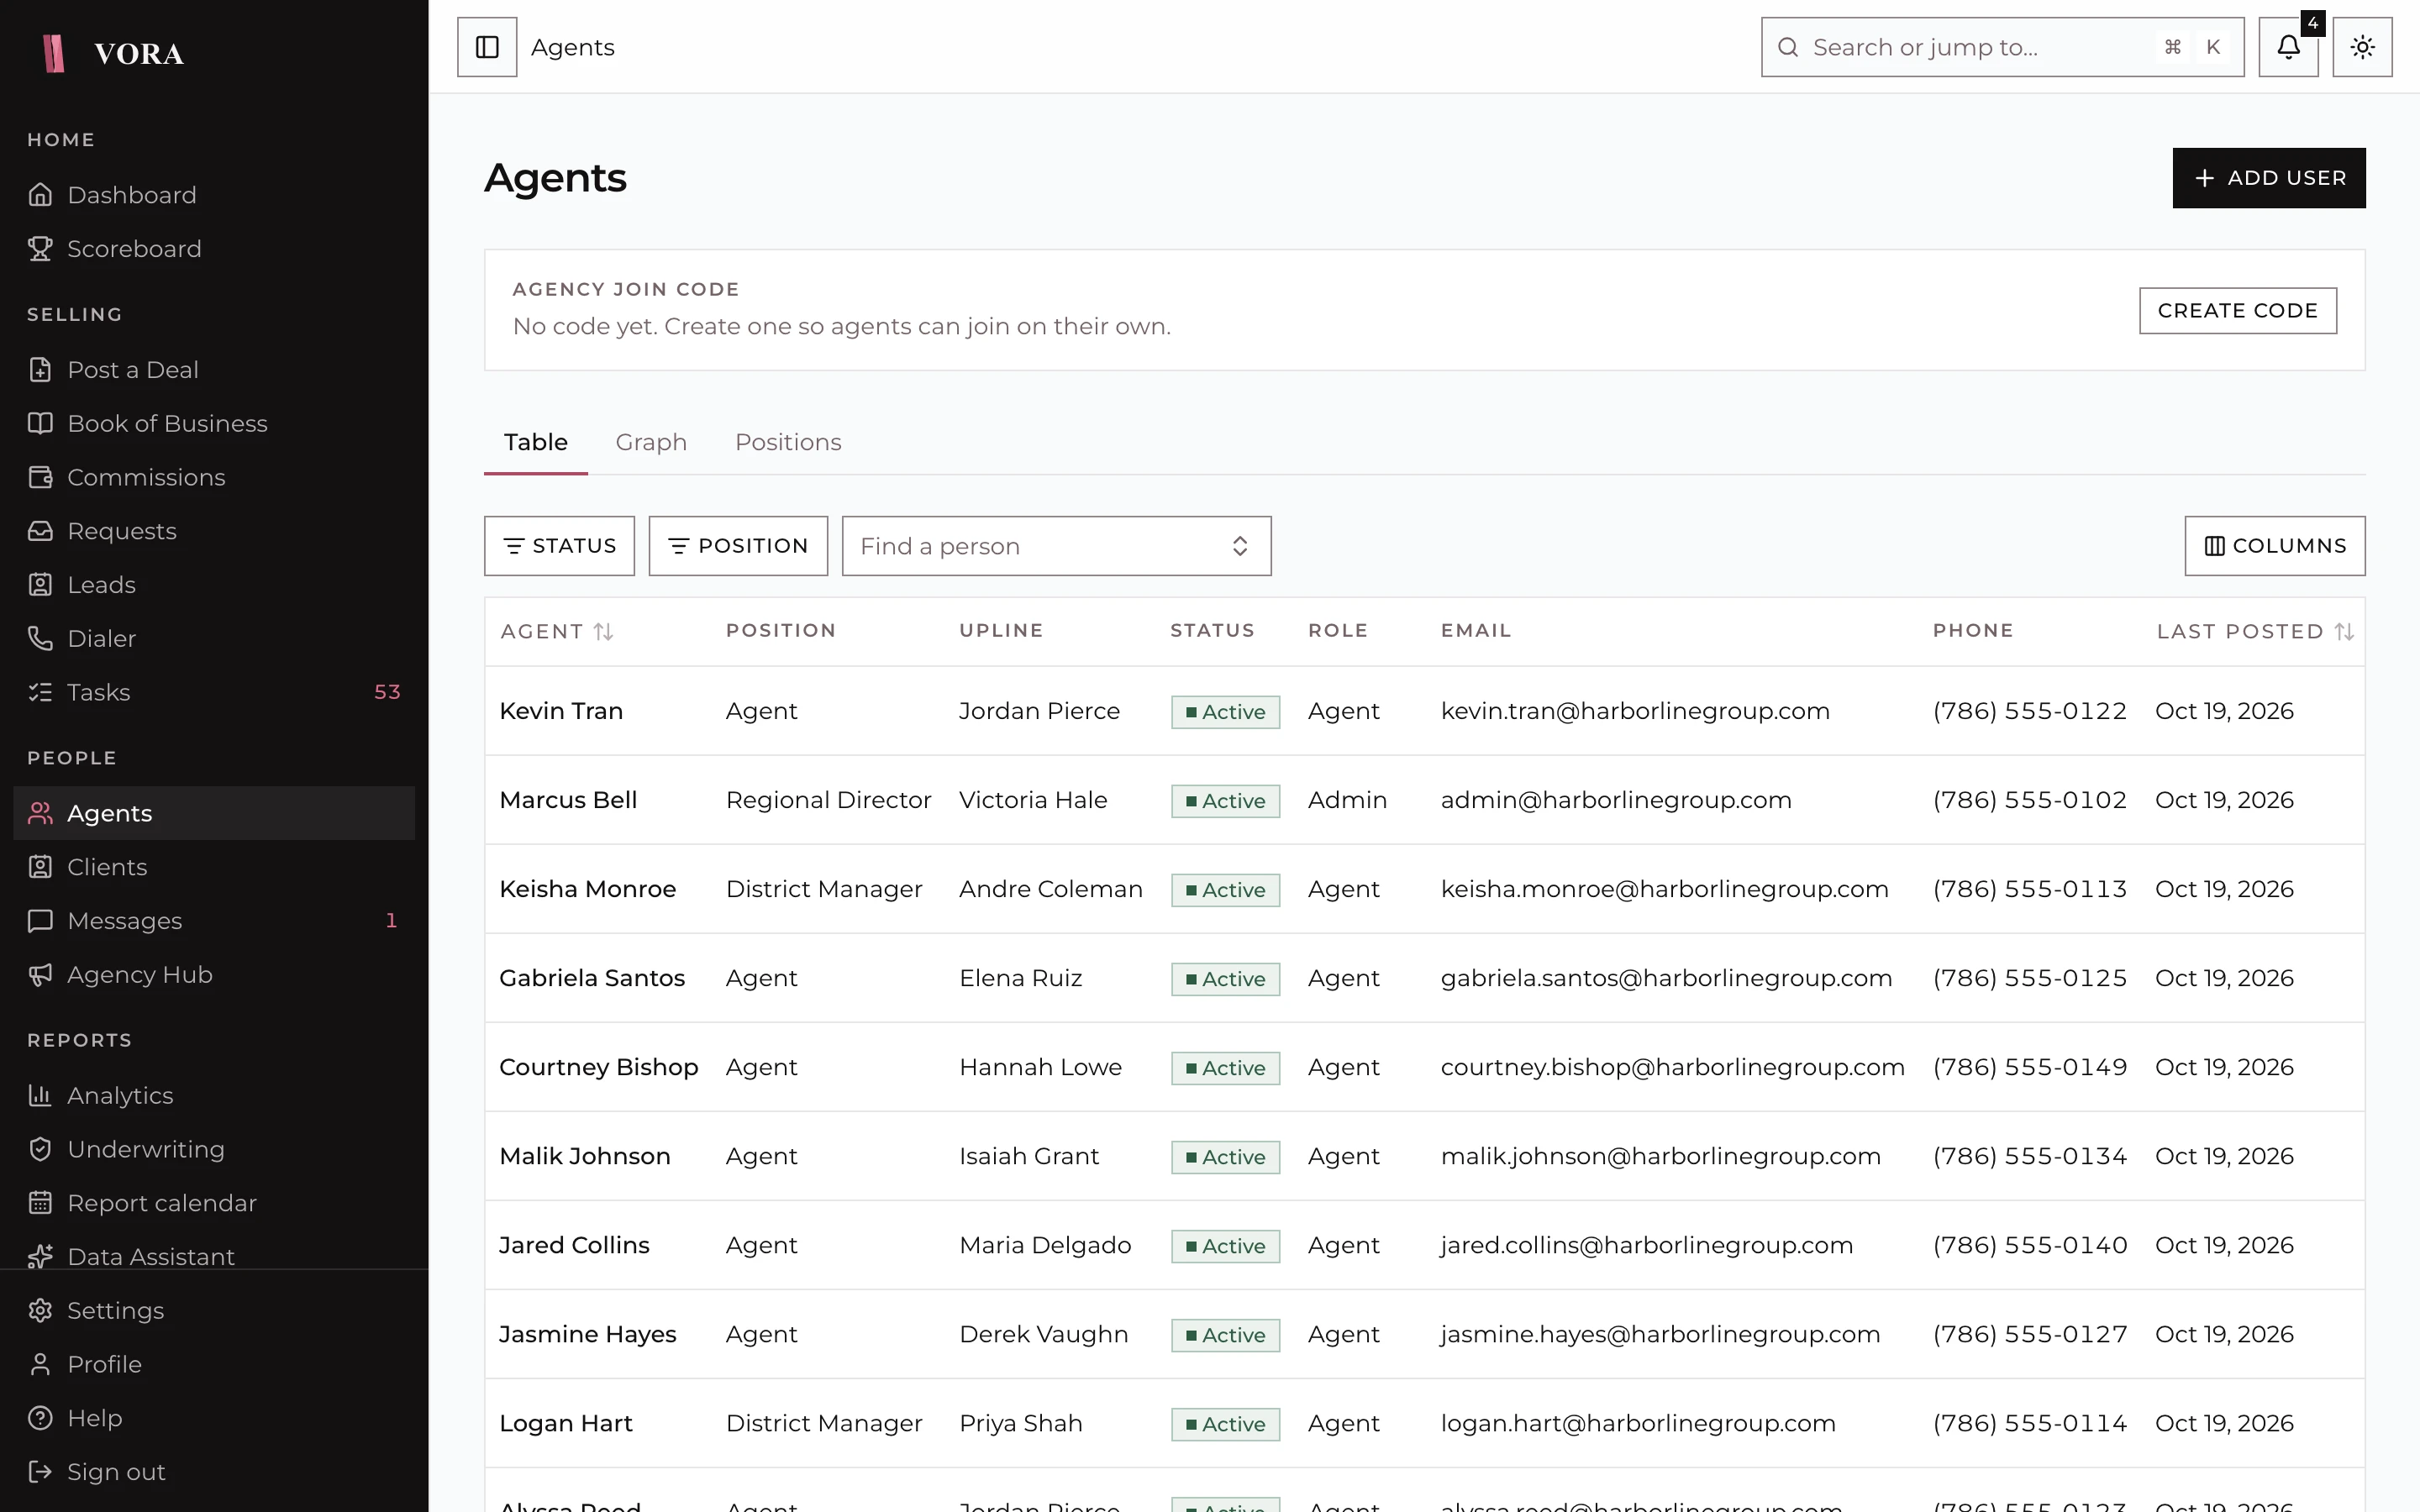
We set up your positions and hierarchy so every manager sees their own team the moment they sign in.